Skip i'r prif gynnwys

Sut i greu siart gyda dyddiad ac amser ar echel X yn Excel?

Yn Excel, rydym fel arfer yn mewnosod siart i ddisgrifio'r data yn well. Ond mewn rhai achosion, pan fyddwch chi'n creu colofn / bar / siart llinell yn seiliedig ar gyfres o ddyddiad ac amser, gellir dangos echel X y siart fel isod y screenshot. Ac yn yr erthygl hon, rwy'n cyflwyno'r ffordd ar gyfer sut i ddangos y dyddiad a'r amser ar echel X yn gywir yn y Siart.
siart doc gydag amser dyddiad 1

Creu siart gyda dyddiad ac amser ar echel X yn gywir


swigen dde glas saeth Creu siart gyda dyddiad ac amser ar echel X yn gywir

Er mwyn arddangos y dyddiad a'r amser yn gywir, dim ond yn yr Echel Fformat deialog.

1. Cliciwch ar y dde ar yr echel X yn y siart, a dewiswch Echel Fformat o'r ddewislen cyd-destun. Gweler y screenshot:
siart doc gydag amser dyddiad 2

2. Yna yn y Echel Fformat cwarel neu Echel Fformat deialog, dan Dewisiadau Echel tab, gwirio Echel testun opsiwn yn y Math Echel adran. Gweler y screenshot:
  siart doc gydag amser dyddiad 4
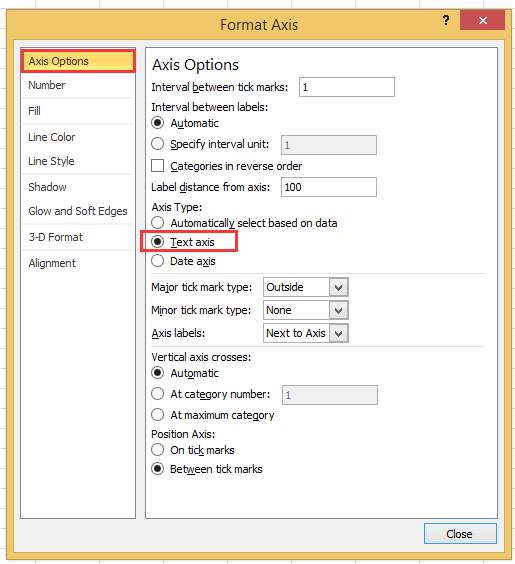
Os ydych chi'n defnyddio'r fersiwn Excel yn hwyrach na 2010, gallwch weld cwarel Fformat Echel yn popio allan, a gwirio opsiwn echel Testun o dan Math Echel yn y grŵp Opsiynau Echel.
siart doc gydag amser dyddiad 3

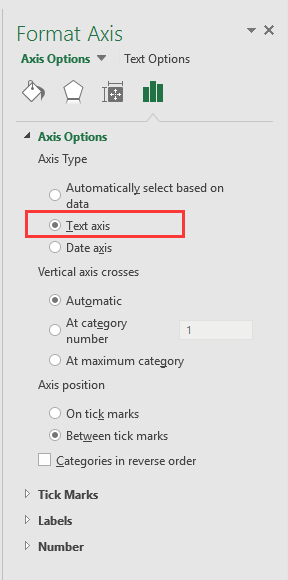
3. Cliciwch Cau neu ewch yn ôl at y siart, yna yna mae data dyddiad ac amser wedi'i arddangos yn gywir yn yr echel X. Gweler y screenshot:
siart doc gydag amser dyddiad 5


Creu siart cyflymdra gyda dau gam!

Weithiau, efallai yr hoffech chi ddefnyddio siart cyflymdra i arddangos pricessing prosiect, ond yn Excel, mae angen llawer o gamau i greu siart cyflymdra sy'n gymhleth ac yn gwastraffu amser. Yma, mae'r Siart cyflymdra offeryn yn Kutools ar gyfer Excel gall eich helpu i greu siart cyflymder safonol gan ddau gam syml. Dadlwythwch yr offeryn hwn gyda threial 30 diwrnod am ddim nawr.
siart cyflymdra doc

Offer Cynhyrchiant Swyddfa Gorau

🤖 Kutools AI Aide: Chwyldro dadansoddi data yn seiliedig ar: Cyflawniad Deallus   |  Cynhyrchu Cod  |  Creu Fformiwlâu Personol  |  Dadansoddi Data a Chynhyrchu Siartiau  |  Invoke Swyddogaethau Kutools...
Nodweddion Poblogaidd: Darganfod, Amlygu neu Adnabod Dyblygiadau   |  Dileu Rhesi Gwag   |  Cyfuno Colofnau neu Gelloedd heb Colli Data   |   Rownd heb Fformiwla ...
Super-edrych: VLookup Meini Prawf Lluosog    VLookup Gwerth Lluosog  |   VLookup Ar Draws Taflenni Lluosog   |   Edrych Niwlog ....
Rhestr gwympo Uwch: Creu Rhestr Gollwng yn Gyflym   |  Rhestr Gollwng Dibynnol   |  Rhestr Gollwng Aml-ddewis ....
Rheolwr Colofn: Ychwanegu Nifer Penodol o Golofnau  |  Symud Colofnau  |  Toglo Statws Gwelededd Colofnau Cudd  |  Cymharwch Ystodau a Cholofnau ...
Nodweddion dan Sylw: Ffocws ar y Grid   |  Golwg Dylunio   |   Bar Fformiwla Mawr    Rheolwr Llyfr Gwaith a Thaflen   |  Llyfrgell Adnoddau (Testun Auto)   |  Dewiswr Dyddiad   |  Cyfuno Taflenni Gwaith   |  Amgryptio/Dadgryptio Celloedd    Anfon E-byst trwy Restr   |  Hidlo Super   |   Hidlo Arbennig (hidlo mewn print trwm/italig/strikethrough...) ...
15 Set Offer Gorau12 Testun offer (Ychwanegu Testun, Dileu Cymeriadau,...)   |   50 + Siart Mathau (Siart Gantt,...)   |   40+ Ymarferol Fformiwlâu (Cyfrifwch oedran yn seiliedig ar ben-blwydd,...)   |   19 mewnosod offer (Mewnosod Cod QR, Mewnosod Llun o'r Llwybr,...)   |   12 Trosi offer (Rhifau i Eiriau, Trosi arian cyfred,...)   |   7 Uno a Hollti offer (Rhesi Cyfuno Uwch, Celloedd Hollt,...)   |   ... a mwy

Supercharge Eich Sgiliau Excel gyda Kutools ar gyfer Excel, a Phrofiad Effeithlonrwydd Fel Erioed Erioed. Kutools ar gyfer Excel Yn Cynnig Dros 300 o Nodweddion Uwch i Hybu Cynhyrchiant ac Arbed Amser.  Cliciwch Yma i Gael Y Nodwedd Sydd Ei Angen Y Mwyaf...

Disgrifiad


Mae Office Tab yn dod â rhyngwyneb Tabbed i Office, ac yn Gwneud Eich Gwaith yn Haws o lawer

  • Galluogi golygu a darllen tabbed yn Word, Excel, PowerPoint, Cyhoeddwr, Mynediad, Visio a Phrosiect.
  • Agor a chreu dogfennau lluosog mewn tabiau newydd o'r un ffenestr, yn hytrach nag mewn ffenestri newydd.
  • Yn cynyddu eich cynhyrchiant 50%, ac yn lleihau cannoedd o gliciau llygoden i chi bob dydd!
Comments (23)
No ratings yet. Be the first to rate!
This comment was minimized by the moderator on the site
I have the same issue when graphing data that has date AND time: points on the graph are equally spaced, whereas the underlying data has unequal gaps between datapoints. Data is in the form "dd/mm/yyyy hh:mm" formatted as date/time (not text). Data spans multiple days so it's not possible to extract just the time element.
This comment was minimized by the moderator on the site
I have a chart with x-axis in time that stretches during about 6h and 35min. I have data for each 20min in the beginning, then 15min and lastly each 10min. Also, in between I have 45min and 5min data.. The issue that I have, and several others, is that each gap between the date are equally spaced out. Meaning that, even if it is only 5min the gap is the same as if it was 45min.
This comment was minimized by the moderator on the site
i want to make a line graph which contains thousand of entries it's included date, time, month and year, so please help me out.
This comment was minimized by the moderator on the site
Hi, syed Mubashir alam, I do not understand your quetion, if you just create a line graph and the x-axis contains month/day/year hour:minute as below screenshot shown:
https://www.extendoffice.com/images/stories/comments/sun-comment/line-chart-1.png
just follow above steps of the article. If your question is about the axis contents are to long, there is no good idea.
This comment was minimized by the moderator on the site
i want to make a line graph which contains thousands of entries including time, date, month and year but i couldn't make a line graph so please help me out.
This comment was minimized by the moderator on the site
It's good coment that point is not a comma. When you want to add more numericals numbers you should use comma in excel ;)
This comment was minimized by the moderator on the site
Excel menus have changed - this is an out of date article - please update for 2020 .. e.g where is AXIS TYPE now?
This comment was minimized by the moderator on the site
I did not found Excel 2020, just 365 2019, which menus are the same as 2013,2016 version.
This comment was minimized by the moderator on the site
How do I remove days that don't have data in them. Example 8/1-8/31 but not data was captured on 8/3 or 8/4, how do I remove those dates from my graph? They are not in my data table so why is it pulling them?
This comment was minimized by the moderator on the site
Open the Excel file that holds the chart from which you want to exclude dates. Click the X-axis, located underneath the chart, so that it becomes surrounded by a small box. Right-click inside the box and choose "Format Axis" from the popup menu. Click "Axis Options" on the left side of the "Format Axis" window. Locate the three "Axis Type" options in the middle of the screen on the right side of the window. Click the radio button next to "Text axis."
This comment was minimized by the moderator on the site
Hi, I have an issue here. When I opened "Format Axis" and "Axis Options", there is no "Axis Type" choice here
This comment was minimized by the moderator on the site
Hi, Agassi, which Excel version you use?
This comment was minimized by the moderator on the site
Easy, useful, but i didn't know. Thanks a lot
This comment was minimized by the moderator on the site
But it doesnt show them in right relation to eachother. For example 2 hours and 6 hours are same in chart..
This comment was minimized by the moderator on the site
Hi Kiwi, maybe you can paint a chart to show me what you want the chart show.
There are no comments posted here yet
Load More
Please leave your comments in English
Posting as Guest
×
Rate this post:
0   Characters
Suggested Locations