Skip i'r prif gynnwys

Sut i gyfrifo cyfartaledd wedi'i bwysoli mewn Tabl Excel Pivot?

Yn gyffredinol, mae'n hawdd cyfrifo'r cyfartaledd wedi'i bwysoli trwy gyfuniad o swyddogaethau SUMPRODUCT a SUM yn Excel. Fodd bynnag, ymddengys nad yw'r meysydd a gyfrifir yn cefnogi'r swyddogaethau mewn tabl colyn. Felly, sut allech chi gyfrifo'r cyfartaledd wedi'i bwysoli mewn tabl colyn? Bydd yr erthygl hon yn cyflwyno datrysiad.

Cyfrifwch gyfartaledd wedi'i bwysoli mewn Tabl Pivot Excel


Cyfrifwch gyfartaledd wedi'i bwysoli mewn Tabl Pivot Excel

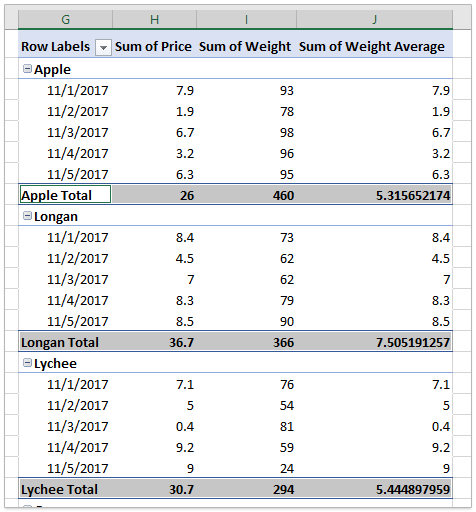
Gan dybio eich bod wedi creu tabl colyn fel y dangosir isod. A byddaf yn cymryd y tabl colyn fel enghraifft i gyfrifo pris cyfartalog wedi'i bwysoli pob ffrwyth yn y tabl colyn.

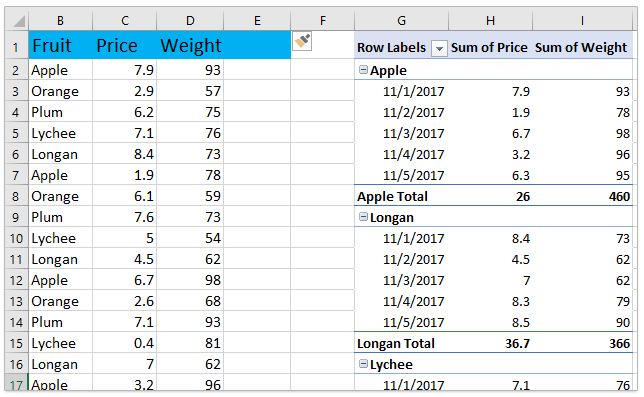
1. Yn gyntaf oll, ychwanegwch golofn cynorthwyydd o swm yn y data ffynhonnell.
Mewnosod colofn wag yn y data ffynhonnell, teipiwch swm fel enw'r golofn, y math nesaf = D2 * E2 yng nghell gyntaf y golofn gynorthwyydd hon, ac yn olaf llusgwch y AutoFill Handle i lenwi'r golofn gyfan. Gweler y screenshot:

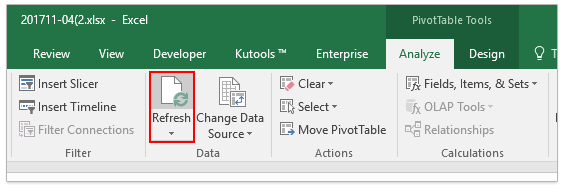
2. Dewiswch unrhyw gell yn y tabl colyn i actifadu'r Offer PivotTable, ac yna cliciwch Dadansodda (neu Dewisiadau)> Adnewyddu. Gweler y screenshot:

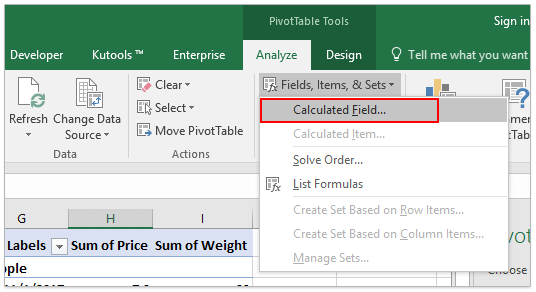
3. Ewch ymlaen i glicio Dadansodda > Meysydd, Eitemau, a Setiau > Maes wedi'i Gyfrifo. Gweler y screenshot:

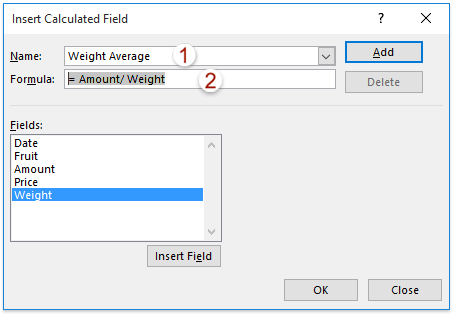
4. Yn y blwch deialog Mewnosod Maes wedi'i Gyfrifo, teipiwch Cyfartaledd Pwysau yn y Enw blwch, math = Swm / Pwysau (newidiwch y fformiwla yn seiliedig ar eich enwau caeau) yn y Fformiwla blwch, ac yna cliciwch ar y OK botwm. Gweler y screenshot:

Nawr byddwch chi'n dychwelyd i'r bwrdd colyn, a byddwch chi'n cael pris cyfartalog wedi'i bwysoli pob ffrwyth yn y rhesi is-gyfanswm. Gweler y screenshot:


Erthyglau cysylltiedig:

Offer Cynhyrchiant Swyddfa Gorau

🤖 Kutools AI Aide: Chwyldro dadansoddi data yn seiliedig ar: Cyflawniad Deallus   |  Cynhyrchu Cod  |  Creu Fformiwlâu Personol  |  Dadansoddi Data a Chynhyrchu Siartiau  |  Invoke Swyddogaethau Kutools...
Nodweddion Poblogaidd: Darganfod, Amlygu neu Adnabod Dyblygiadau   |  Dileu Rhesi Gwag   |  Cyfuno Colofnau neu Gelloedd heb Colli Data   |   Rownd heb Fformiwla ...
Super-edrych: VLookup Meini Prawf Lluosog    VLookup Gwerth Lluosog  |   VLookup Ar Draws Taflenni Lluosog   |   Edrych Niwlog ....
Rhestr gwympo Uwch: Creu Rhestr Gollwng yn Gyflym   |  Rhestr Gollwng Dibynnol   |  Rhestr Gollwng Aml-ddewis ....
Rheolwr Colofn: Ychwanegu Nifer Penodol o Golofnau  |  Symud Colofnau  |  Toglo Statws Gwelededd Colofnau Cudd  |  Cymharwch Ystodau a Cholofnau ...
Nodweddion dan Sylw: Ffocws ar y Grid   |  Golwg Dylunio   |   Bar Fformiwla Mawr    Rheolwr Llyfr Gwaith a Thaflen   |  Llyfrgell Adnoddau (Testun Auto)   |  Dewiswr Dyddiad   |  Cyfuno Taflenni Gwaith   |  Amgryptio/Dadgryptio Celloedd    Anfon E-byst trwy Restr   |  Hidlo Super   |   Hidlo Arbennig (hidlo mewn print trwm/italig/strikethrough...) ...
15 Set Offer Gorau12 Testun offer (Ychwanegu Testun, Dileu Cymeriadau,...)   |   50 + Siart Mathau (Siart Gantt,...)   |   40+ Ymarferol Fformiwlâu (Cyfrifwch oedran yn seiliedig ar ben-blwydd,...)   |   19 mewnosod offer (Mewnosod Cod QR, Mewnosod Llun o'r Llwybr,...)   |   12 Trosi offer (Rhifau i Eiriau, Trosi arian cyfred,...)   |   7 Uno a Hollti offer (Rhesi Cyfuno Uwch, Celloedd Hollt,...)   |   ... a mwy

Supercharge Eich Sgiliau Excel gyda Kutools ar gyfer Excel, a Phrofiad Effeithlonrwydd Fel Erioed Erioed. Kutools ar gyfer Excel Yn Cynnig Dros 300 o Nodweddion Uwch i Hybu Cynhyrchiant ac Arbed Amser.  Cliciwch Yma i Gael Y Nodwedd Sydd Ei Angen Y Mwyaf...

Disgrifiad


Mae Office Tab yn dod â rhyngwyneb Tabbed i Office, ac yn Gwneud Eich Gwaith yn Haws o lawer

  • Galluogi golygu a darllen tabbed yn Word, Excel, PowerPoint, Cyhoeddwr, Mynediad, Visio a Phrosiect.
  • Agor a chreu dogfennau lluosog mewn tabiau newydd o'r un ffenestr, yn hytrach nag mewn ffenestri newydd.
  • Yn cynyddu eich cynhyrchiant 50%, ac yn lleihau cannoedd o gliciau llygoden i chi bob dydd!
Comments (11)
No ratings yet. Be the first to rate!
This comment was minimized by the moderator on the site
Wouldn't you have the same result if you dragged a second time the field "Price" and change the value field setting summarize by Average?
This comment was minimized by the moderator on the site
That will not give you the weighted average
This comment was minimized by the moderator on the site
Sabrás que me estaba reventando el cerebro en tratar de hacerlo en power pivot, pero con esto te pasaste de bravo, gracias doc.
This comment was minimized by the moderator on the site
THANK YOU SOOO MUCH!!!!! YOU ARE A ANGEL FROM HEAVEN <3
This comment was minimized by the moderator on the site
THANK YOU! Love it. It works for me at multiple level. Genius way to solve an issue in a simple way.
This comment was minimized by the moderator on the site
This just wrong I think. Why is the average and wrigher average the same number? Multiplying and divining just cancel out and you are left with the same result. Grrrr..
This comment was minimized by the moderator on the site
You are comparing the weighted average of one data point to the average of one data point. They will always be the same. If you look at the totals row, the average it is giving you is the weighted average (5.31...) not the average (5.2)
This comment was minimized by the moderator on the site
Awesome! Never thought of a helper column lol
This comment was minimized by the moderator on the site
i like it, but what if you need to add extra conditions?
This comment was minimized by the moderator on the site
Hi Meeeee,
What kinds of conditions will you add? In most cases, you can update your source table, refresh the PivotTable, and then add calculated fields.
This comment was minimized by the moderator on the site
Te la rifaste campeón, denle una cerveza bien fría a este hombre.
There are no comments posted here yet
Please leave your comments in English
Posting as Guest
×
Rate this post:
0   Characters
Suggested Locations